Visualizations enable effective communication with stakeholders [RZM14].
Communication with stakeholders is critical for the success of EAM initiatives. A good basis for communication can be created using visualizations of the EA [RZM14].
Views, reports and metrics are the types of visualizations that can be created if the necessary information is available [Ale+15]. A view represents a stakeholders perspective on the architectural description and comprises one or more architecture models [11a]. Reports are defined as being textual documentations, supporting the Enterprise Architect with his tasks. Finally, metrics are used to quantify the performance and the complexity of an EA [Ale+15].
The information needed for creating visualizations can be collected using an EAM tool [Fuh12]. Since value is only created when the information is processed into stakeholder oriented visualizations, these tools usually also provide features enabling the automatic generation of the respective visualizations [Fuh11b].
The advantages of visualizations are that they support the communication and analysis of complex information, that they increase transparency of the EA and that they promote EAM stakeholder involvement [RZM14]. Additionally, visualizations promote the usage of a common vocabulary between the EA team and stakeholders [Fuh11b].
An extensive list of visualization types, their stakeholders, their usage, their usage domain as well as examples of each visualization type is provided in the Enterprise Architecture Visualization Tool Survey 2014 created at the Chair for Software Engineering of Business Information Systems at the Technische Universität München [RZM14]. The 26 visualization types are illustrated in Figure 1.
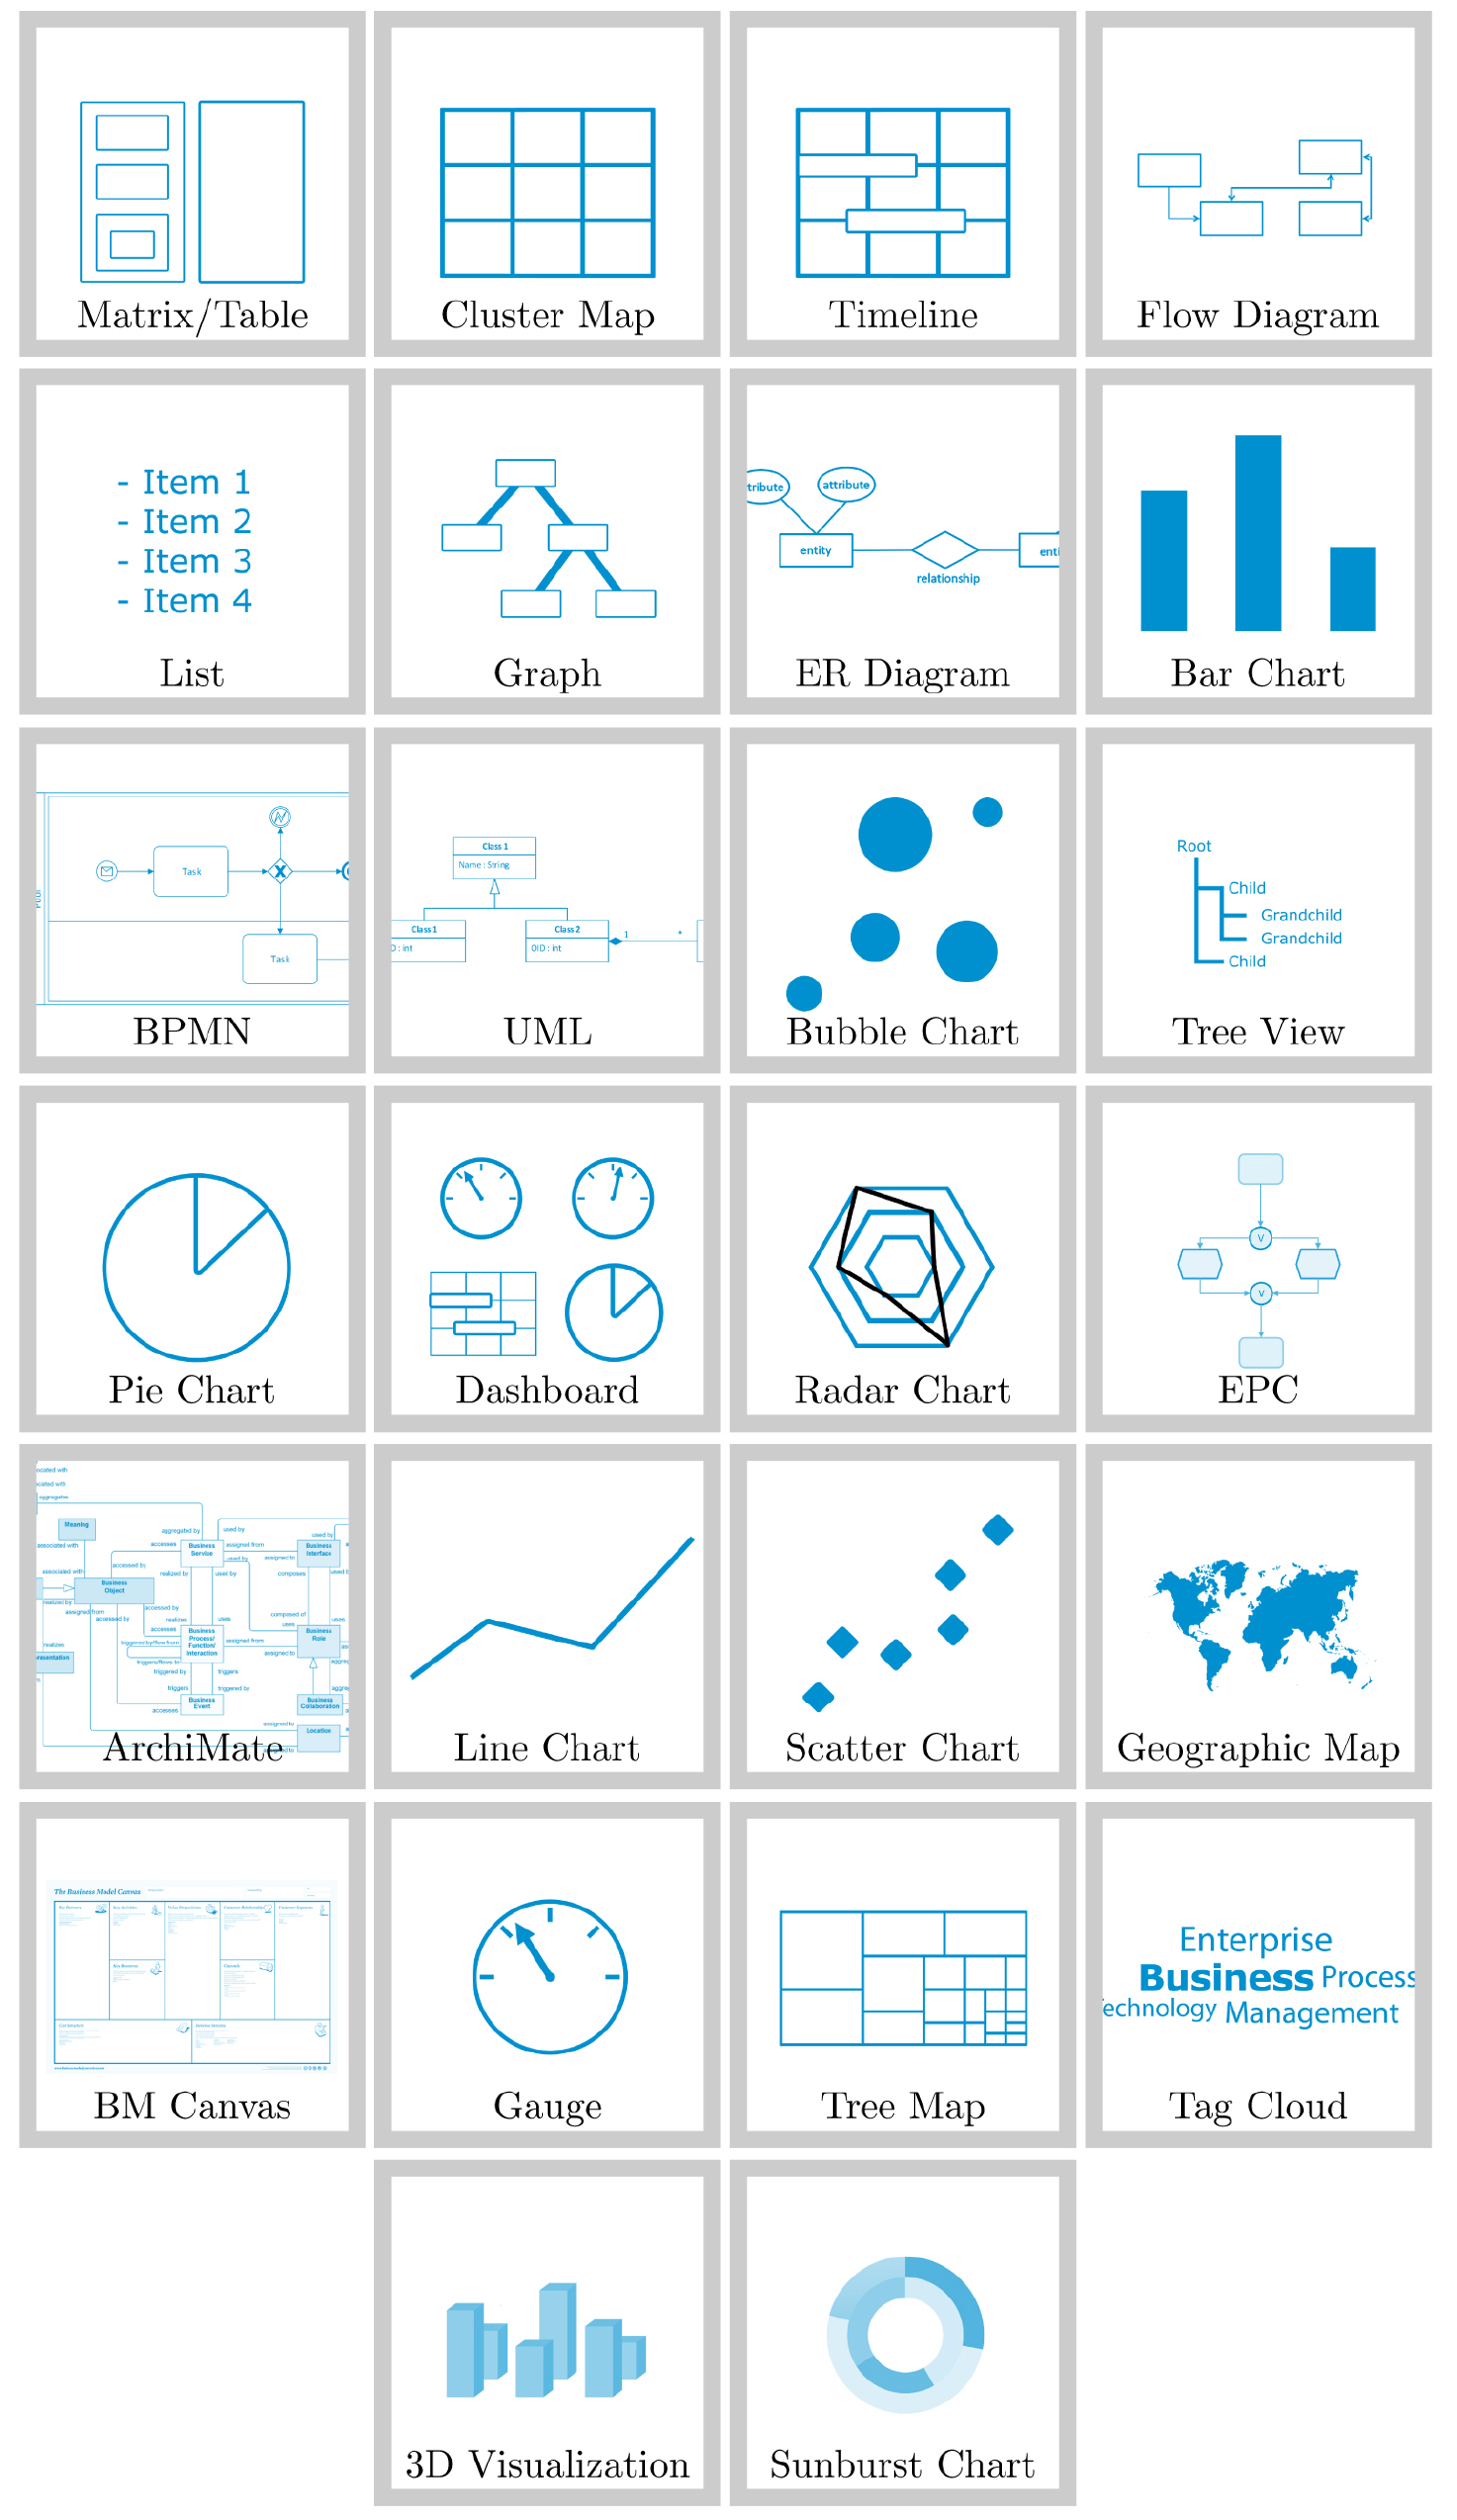
Figure 1: Overview of 26 visualization types identified in the Enterprise Architecture Visualization Tool Survey 2014 created at the Chair for Software Engineering of Business Information Systems at the Technische Universität München. [Source: S. Roth, M. Zec, and F. Matthes. Enterprise Architecture Visualization Tool Survey 2014. Tech. rep. Munich: Chair for Software Engineering of Business Information Systems. Technische Universität München., 2014.]
Sources:
|
[RZM14] |
S. Roth, M. Zec, and F. Matthes. Enterprise Architecture Visualization Tool Survey 2014. Tech. rep. Munich: Chair for Software Engineering of Business Information Systems. Technische Universität München., 2014. |
|
[Ale+15] |
P. Aleatrati Khosroshahi, M. Hauder, A. W. Schneider, and F. Matthes. Enterprise Architecture Management Pattern Catalog V2. Tech. rep. Munich, Germany: Technichal University of Munich (TUM), 2015. |
|
[Fuh11b] |
K. Fuhrer. “Teil 2: Standardblickwinkel und Praxissichten Planung und Steuerung.” In: Enterprise Architecture Deliverables: Welche Ergebnisse liefert Enterprise Architecture? OPITZ CONSULTING GmbH. 2011. |
|
[Fuh12] |
K. Fuhrer. “Enterprise Architecture Management - Zielgruppenspezifische Architektursichten.” In: Informatik Management und Consulting (IM) 4 (2012). |
|
[11a] |
ISO/IEC/IEEE 42010:2011 Systems and software engineering - Architecture description, Ingenierie des systemes et des logiciels - Description de l’architecture. Standard. International Organization for Standardization, 2011. |